Catalog >
NOAA HRRR analysis >
Validation report
NOAA HRRR analysis validation report
Started: 2026-05-07T13:48:20 local
Datasets
| Role | Name | ID / Version | URL |
|---|---|---|---|
| Validation | NOAA HRRR analysis | noaa-hrrr-analysis v0.2.0 |
s3://us-west-2.opendata.source.coop/dynamical/noaa-hrrr-analysis/v0.2.0.zarr |
| Reference | NOAA GEFS analysis | noaa-gefs-analysis 0.1.2 |
https://data.dynamical.org/noaa/gefs/analysis/latest.zarr |
Run parameters
- Validation dataset type: analysis
- Validation time range: time 2014-10-01T00:00 → 2026-05-07T11:00
- Reference time range: time 2000-01-01T00:00 → 2026-05-07T06:00
- Time scope: full dataset
- Ensemble member: n/a
- Point 1: lat=46.1822, lon=-116.2424
- Point 2: lat=22.0012, lon=-72.8126
- Spatial comparison time: 2025-07-13T16:00 (reference at 2025-07-13T15:00)
- Timeseries period: Analysis period: 2021-03-09T06:17 - 2021-03-19T06:17
Combined plots
- nulls:
combined_nulls.png - spatial:
combined_spatial.png - temporal:
combined_temporal.png
Missing timestamps
12360 missing timestamps across 6 (variable, point) combinations.
Full list: missing_timestamps.txt
| Variable | Point | Count |
|---|---|---|
downward_short_wave_radiation_flux_surface |
P1 | 2067 |
downward_short_wave_radiation_flux_surface |
P2 | 2067 |
precipitation_surface |
P1 | 2059 |
precipitation_surface |
P2 | 2059 |
temperature_2m |
P1 | 2054 |
temperature_2m |
P2 | 2054 |
Variables overview
| Variable | Units | Long name | Nulls @ P1 | Nulls @ P2 | Plots |
|---|---|---|---|---|---|
downward_short_wave_radiation_flux_surface |
W m-2 | Surface downward short-wave radiation flux | 2067/101676 | 2067/101676 | nulls · spatial · temporal |
precipitation_surface |
kg m-2 s-1 | Precipitation rate | 2059/101676 | 2059/101676 | nulls · spatial · temporal |
temperature_2m |
degree_Celsius | 2 metre temperature | 2054/101676 | 2054/101676 | nulls · spatial · temporal |
Per-variable details
downward_short_wave_radiation_flux_surface
Metadata
- units:
W m-2 - long_name: Surface downward short-wave radiation flux
- short_name: sdswrf
- standard_name: surface_downwelling_shortwave_flux_in_air
- step_type: instant
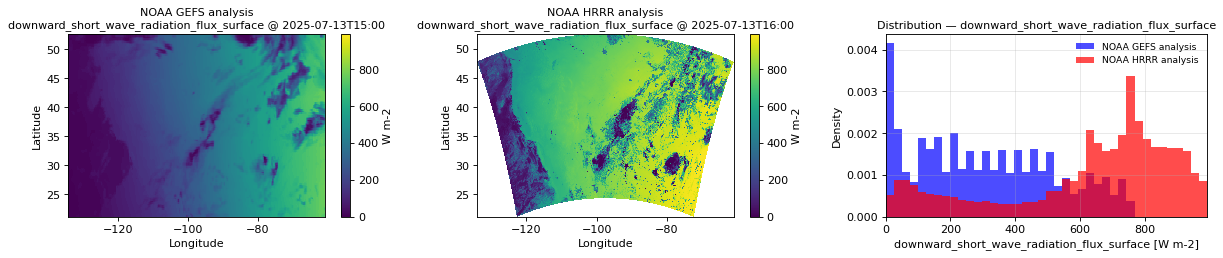
Spatial comparison
- plot:
spatial_downward_short_wave_radiation_flux_surface.png - time: 2025-07-13T16:00 (reference at 2025-07-13T15:00)
- validation: min=0, max=992, mean=628.2
- reference: min=0, max=768, mean=308.2
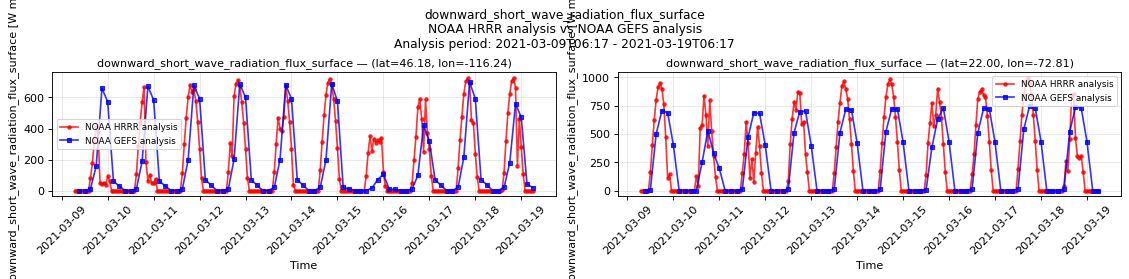
Temporal comparison
- plot:
temporal_downward_short_wave_radiation_flux_surface.png - period: Analysis period: 2021-03-09T06:17 - 2021-03-19T06:17
- validation @ P1 (lat=46.18, lon=-116.24): min=0, max=728, mean=162.6
- validation @ P2 (lat=22.00, lon=-72.81): min=0, max=996, mean=242.7
- reference @ P1: min=0, max=700, mean=167.7
- reference @ P2: min=0, max=744, mean=279.6
Nulls
- P1 nulls: 2067/101676 — 2067 missing (first: 2014-10-02T12:00:00, 2014-10-05T00:00:00, 2014-10-05T02:00:00 … last: 2019-05-04T22:00:00, 2019-11-22T18:00:00, 2020-11-12T09:00:00)
- P2 nulls: 2067/101676 — 2067 missing (first: 2014-10-02T12:00:00, 2014-10-05T00:00:00, 2014-10-05T02:00:00 … last: 2019-05-04T22:00:00, 2019-11-22T18:00:00, 2020-11-12T09:00:00)

precipitation_surface
Metadata
- units:
kg m-2 s-1 - long_name: Precipitation rate
- short_name: prate
- standard_name: precipitation_flux
- step_type: avg
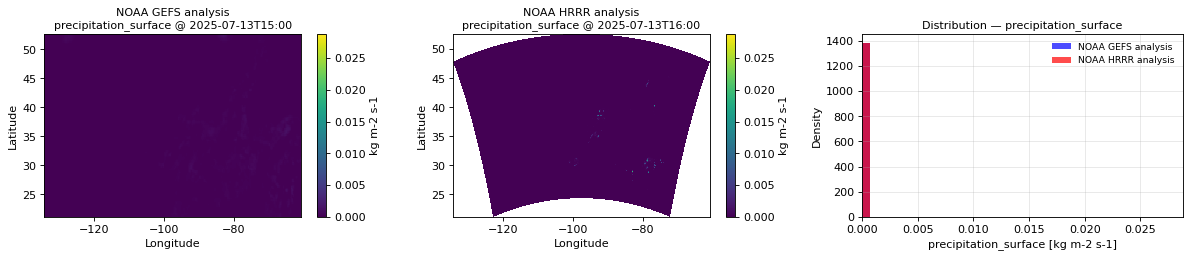
Spatial comparison
- plot:
spatial_precipitation_surface.png - time: 2025-07-13T16:00 (reference at 2025-07-13T15:00)
- validation: min=0, max=0.02881, mean=1.03e-05
- reference: min=0, max=0.00135, mean=3.194e-05
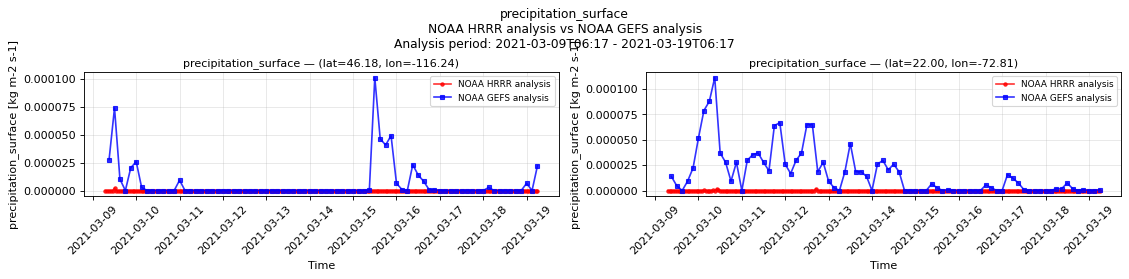
Temporal comparison
- plot:
temporal_precipitation_surface.png - period: Analysis period: 2021-03-09T06:17 - 2021-03-19T06:17
- validation @ P1 (lat=46.18, lon=-116.24): min=0, max=2.25e-06, mean=9.375e-09
- validation @ P2 (lat=22.00, lon=-72.81): min=0, max=1.669e-06, mean=1.458e-08
- reference @ P1: min=0, max=0.0001011, mean=6.179e-06
- reference @ P2: min=0, max=0.0001111, mean=1.704e-05
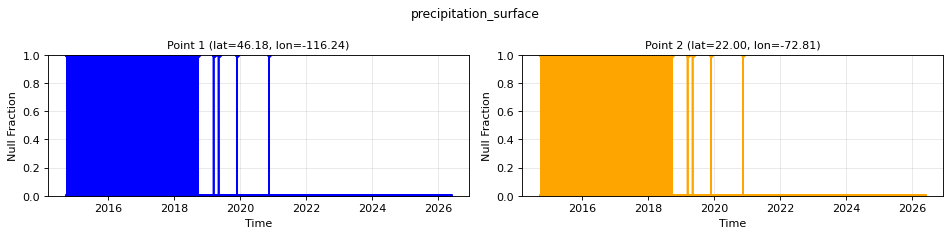
Nulls
- P1 nulls: 2059/101676 — 2059 missing (first: 2014-10-01T00:00:00, 2014-10-02T13:00:00, 2014-10-05T01:00:00 … last: 2019-11-22T18:00:00, 2019-11-22T19:00:00, 2020-11-12T10:00:00)
- P2 nulls: 2059/101676 — 2059 missing (first: 2014-10-01T00:00:00, 2014-10-02T13:00:00, 2014-10-05T01:00:00 … last: 2019-11-22T18:00:00, 2019-11-22T19:00:00, 2020-11-12T10:00:00)
temperature_2m
Metadata
- units:
degree_Celsius - long_name: 2 metre temperature
- short_name: 2t
- standard_name: air_temperature
- step_type: instant
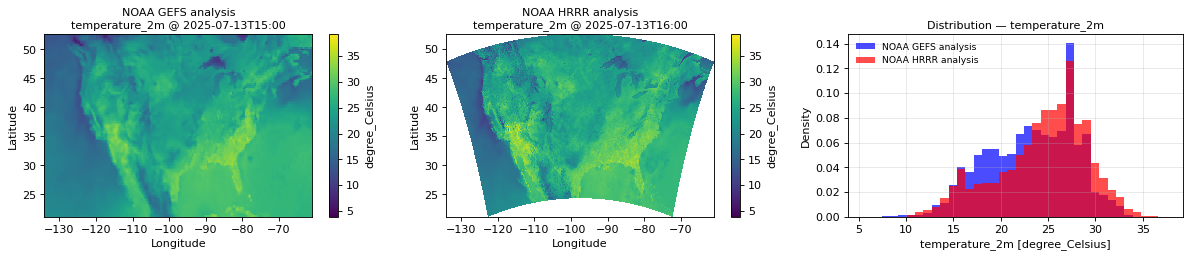
Spatial comparison
- plot:
spatial_temperature_2m.png - time: 2025-07-13T16:00 (reference at 2025-07-13T15:00)
- validation: min=3.875, max=39.25, mean=24.43
- reference: min=5.5, max=34.25, mean=23.29
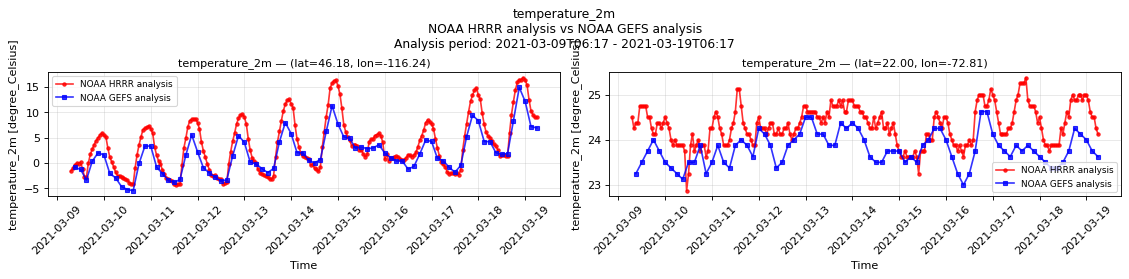
Temporal comparison
- plot:
temporal_temperature_2m.png - period: Analysis period: 2021-03-09T06:17 - 2021-03-19T06:17
- validation @ P1 (lat=46.18, lon=-116.24): min=-4.344, max=16.88, mean=3.612
- validation @ P2 (lat=22.00, lon=-72.81): min=22.88, max=25.38, mean=24.33
- reference @ P1: min=-5.438, max=14.94, mean=1.835
- reference @ P2: min=23, max=24.62, mean=23.79
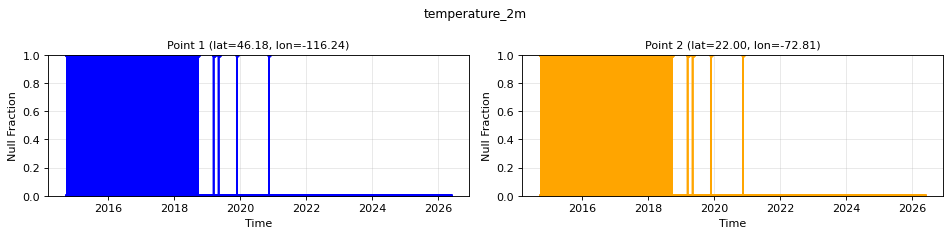
Nulls
- P1 nulls: 2054/101676 — 2054 missing (first: 2014-10-02T12:00:00, 2014-10-05T00:00:00, 2014-10-05T02:00:00 … last: 2019-05-04T22:00:00, 2019-11-22T18:00:00, 2020-11-12T09:00:00)
- P2 nulls: 2054/101676 — 2054 missing (first: 2014-10-02T12:00:00, 2014-10-05T00:00:00, 2014-10-05T02:00:00 … last: 2019-05-04T22:00:00, 2019-11-22T18:00:00, 2020-11-12T09:00:00)