ECMWF AIFS ENS forecast validation report
This dataset validation report plots a sample of values from the ECMWF AIFS ENS forecast dataset over time and across space, comparing where possible to a previously validated reference dataset. It also reports the quantity of missing values and their associated timestamps. These analyses are one layer of a multi-layered dataset validation process we perform at dynamical.org and also provide users a preview of the dataset contents.
Report generation start time: 2026-05-15T02:24:17 UTC
Summary
This validation review found no data quality issues. The dataset is suitable for use.
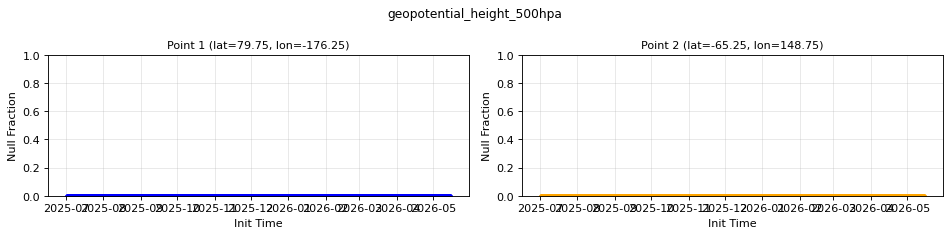
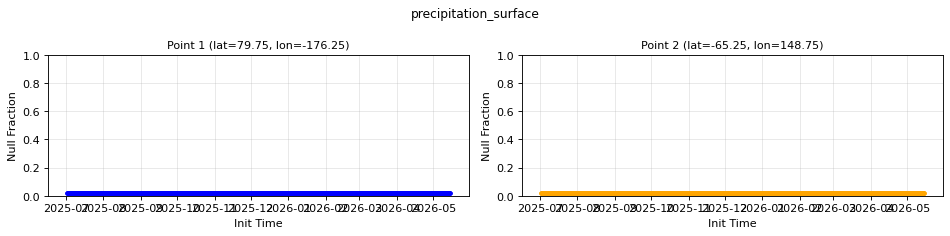
- Complete coverage. All 17 variables are fully populated at the two sampled points across the available dataset window (2025-07-02 → 2026-05-14) — see
combined_nulls.png. - Maps are correctly oriented and projected. North at the top, east on the right, longitudes from -180° to +180°; continents, coastlines, and Antarctica appear where expected with no flipped, rotated, or seam artifacts.
- Values are within physically realistic ranges, with no sentinel values bleeding through. Examples observed across the global grid: 2-metre temperature -53 to +42 °C, surface pressure 48–104 kPa (the low end being Antarctic plateau elevations), mean sea level pressure 95–104 kPa, 10 m and 100 m winds within ±35 m s⁻¹, total cloud cover 0–100 %, precipitation rate up to ~2.8 × 10⁻³ kg m⁻² s⁻¹.
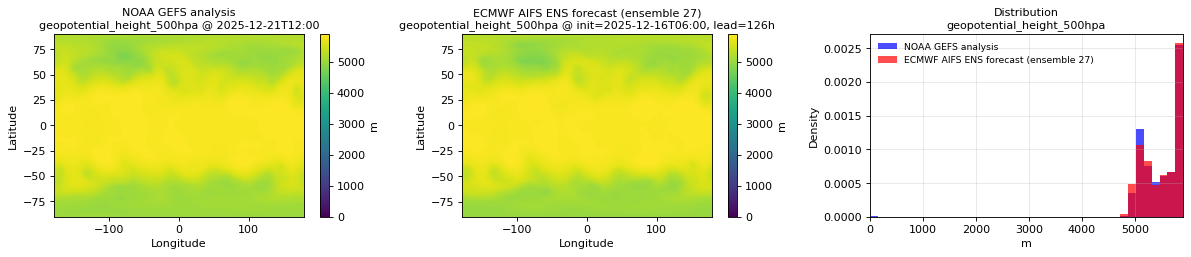
- Distributions agree with the NOAA GEFS analysis reference for variables present in both datasets, with no offsets that would indicate unit or scale errors. Pressure-level variables not in the reference (
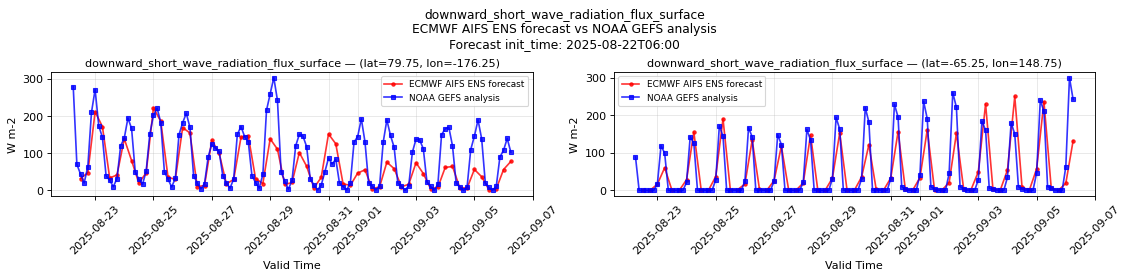
temperature_850hpa,temperature_925hpa,geopotential_height_850hpa,geopotential_height_925hpa,dew_point_temperature_2m) show meteorologically consistent patterns — e.g. 850 hPa temperature warmest near the equator and decreasing toward the poles. - Diurnal cycles are in phase with the reference. Shortwave radiation peaks at the same local time as in GEFS at both sampled points — see
temporal_downward_short_wave_radiation_flux_surface.png. - Accumulated variables reset per forecast as expected. Precipitation and shortwave/longwave radiation (stored as average rates) start at zero at each new forecast cycle and show realistic within-forecast variability.
- No quantization artifacts. No banding or staircasing was visible in any spatial map or time series — the compression settings preserve sufficient precision for the dataset's intended use.
Datasets
| Role | Name | ID | Version | URL |
|---|---|---|---|---|
| Validation | ECMWF AIFS ENS forecast | ecmwf-aifs-ens-forecast |
v0.1.0 |
s3://dynamical-ecmwf-aifs-ens/ecmwf-aifs-ens-forecast/v0.1.0.icechunk |
| Reference | NOAA GEFS analysis | noaa-gefs-analysis |
0.1.2 |
https://data.dynamical.org/noaa/gefs/analysis/latest.zarr |
Run parameters
- Validation dataset type: forecast
- Validation time range: init_time 2025-07-02T00:00 → 2026-05-14T18:00
- Reference time range: time 2000-01-01T00:00 → 2026-05-14T18:00
- Time scope: full dataset
- Ensemble member: 27
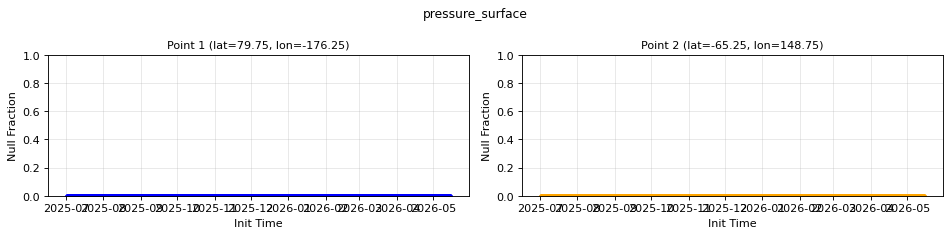
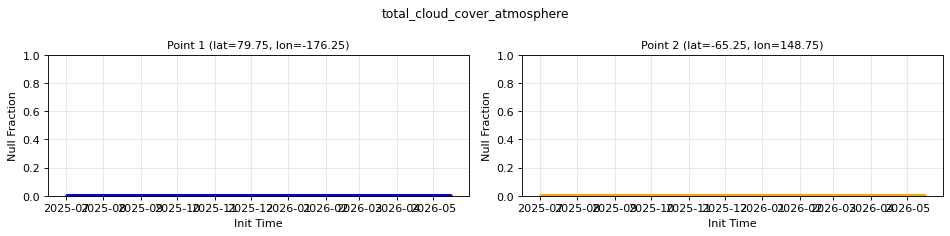
Missing values
- Point 1: lat=79.7500, lon=-176.2500
- Point 2: lat=-65.2500, lon=148.7500
Spatial and distribution
- Spatial comparison time: init=2025-12-16T06:00, lead=126h (reference at 2025-12-21T12:00)
Time series
- Point 1: lat=79.7500, lon=-176.2500
- Point 2: lat=-65.2500, lon=148.7500
- Timeseries period: Forecast init_time: 2025-08-22T06:00
Combined plots
All variables combined into a single plot for each type of analysis.
- Missing values:
combined_nulls.png - Spatial and distributions:
combined_spatial.png - Time series:
combined_temporal.png
Missing timestamps
None detected at the two sampled points.
Per-variable details
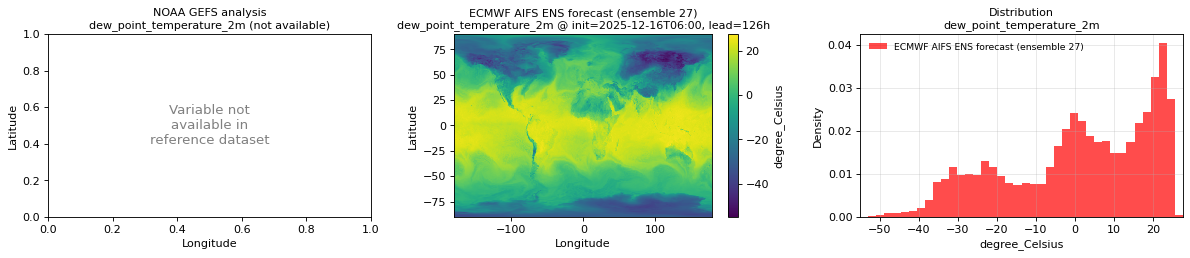
dew_point_temperature_2m
Metadata
- units:
degree_Celsius - long_name: 2 metre dewpoint temperature
- short_name: 2d
- standard_name: dew_point_temperature
- step_type: instant
Spatial comparison
- plot:
spatial_dew_point_temperature_2m.png - time: init=2025-12-16T06:00, lead=126h (reference at 2025-12-21T12:00)
- validation: min=-55, mean=0.8136, max=27.62
- reference: variable not available in reference dataset
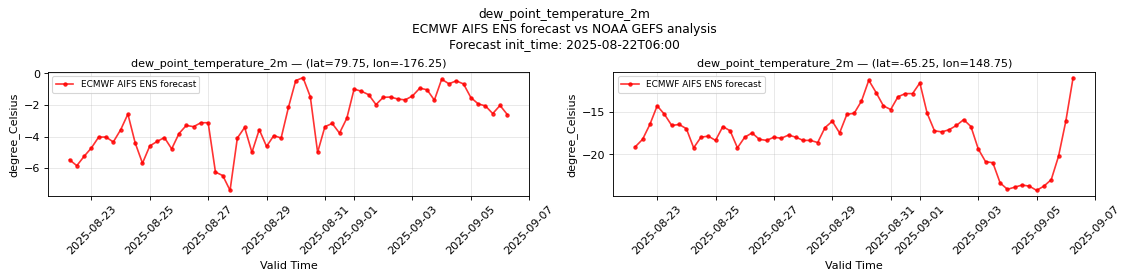
Temporal comparison
- plot:
temporal_dew_point_temperature_2m.png - period: Forecast init_time: 2025-08-22T06:00
P1 (lat=79.75, lon=-176.25):
- validation: min=-7.406, mean=-3.075, max=-0.2715
- reference: variable not available in reference dataset
P2 (lat=-65.25, lon=148.75):
- validation: min=-24.25, mean=-17.59, max=-11
- reference: variable not available in reference dataset
Nulls
- P1 nulls: 0/3944748 — none
- P2 nulls: 0/3944748 — none

downward_long_wave_radiation_flux_surface
Metadata
- units:
W m-2 - long_name: Surface downward long-wave radiation flux
- short_name: sdlwrf
- standard_name: surface_downwelling_longwave_flux_in_air
- step_type: avg
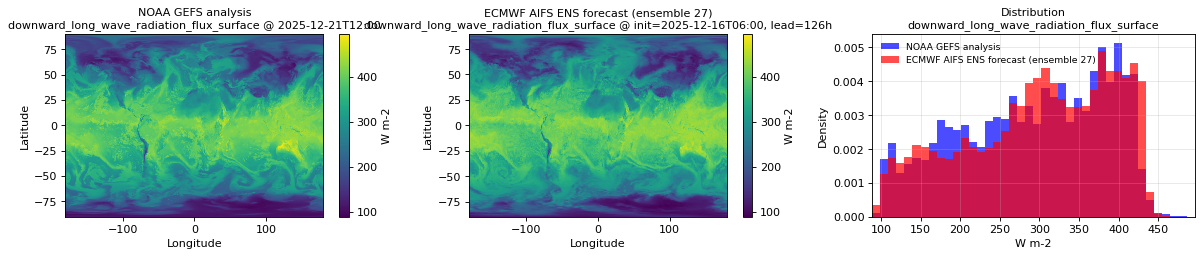
Spatial comparison
- plot:
spatial_downward_long_wave_radiation_flux_surface.png - time: init=2025-12-16T06:00, lead=126h (reference at 2025-12-21T12:00)
- validation: min=89, mean=299.2, max=476
- reference: min=94, mean=292.1, max=496
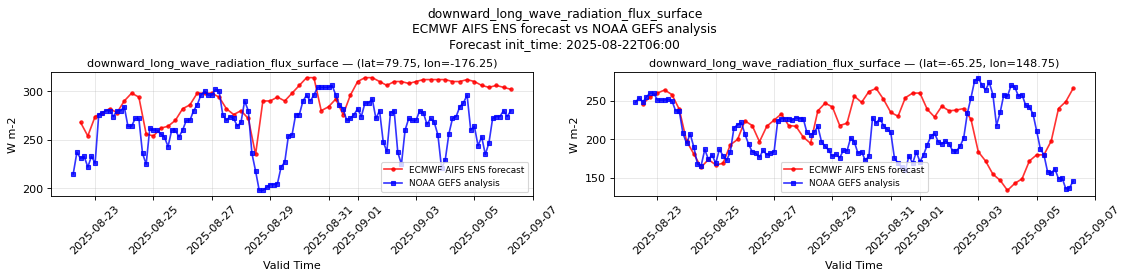
Temporal comparison
- plot:
temporal_downward_long_wave_radiation_flux_surface.png - period: Forecast init_time: 2025-08-22T06:00
P1 (lat=79.75, lon=-176.25):
- validation: min=235, mean=292.5, max=314
- reference: min=198, mean=264.6, max=306
P2 (lat=-65.25, lon=148.75):
- validation: min=134, mean=217.1, max=266
- reference: min=136, mean=207, max=280
Nulls
- P1 nulls: 0/3880080 — none
- P2 nulls: 0/3880080 — none

downward_short_wave_radiation_flux_surface
Metadata
- units:
W m-2 - long_name: Surface downward short-wave radiation flux
- short_name: sdswrf
- standard_name: surface_downwelling_shortwave_flux_in_air
- step_type: avg
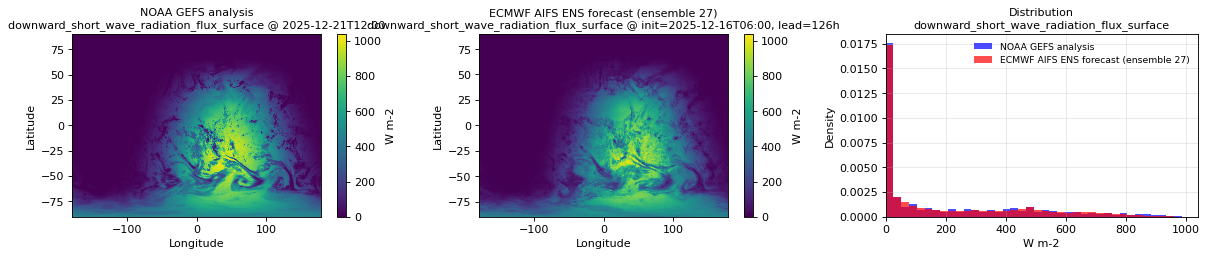
Spatial comparison
- plot:
spatial_downward_short_wave_radiation_flux_surface.png - time: init=2025-12-16T06:00, lead=126h (reference at 2025-12-21T12:00)
- validation: min=0, mean=193.6, max=1040
- reference: min=0, mean=201.1, max=1008
Temporal comparison
- plot:
temporal_downward_short_wave_radiation_flux_surface.png - period: Forecast init_time: 2025-08-22T06:00
P1 (lat=79.75, lon=-176.25):
- validation: min=1.898, mean=64.25, max=223
- reference: min=0, mean=88.07, max=304
P2 (lat=-65.25, lon=148.75):
- validation: min=0, mean=48.64, max=250
- reference: min=0, mean=50.41, max=300
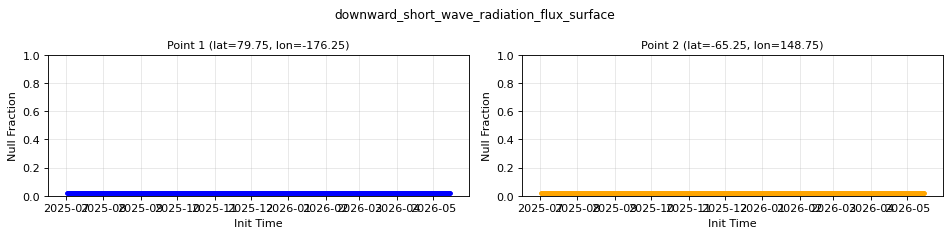
Nulls
- P1 nulls: 0/3880080 — none
- P2 nulls: 0/3880080 — none
geopotential_height_500hpa
Metadata
- units:
m - long_name: Geopotential height
- short_name: gh
- standard_name: geopotential_height
- step_type: instant
Spatial comparison
- plot:
spatial_geopotential_height_500hpa.png - time: init=2025-12-16T06:00, lead=126h (reference at 2025-12-21T12:00)
- validation: min=4742, mean=5507, max=5906
- reference: min=0, mean=5500, max=5898
Temporal comparison
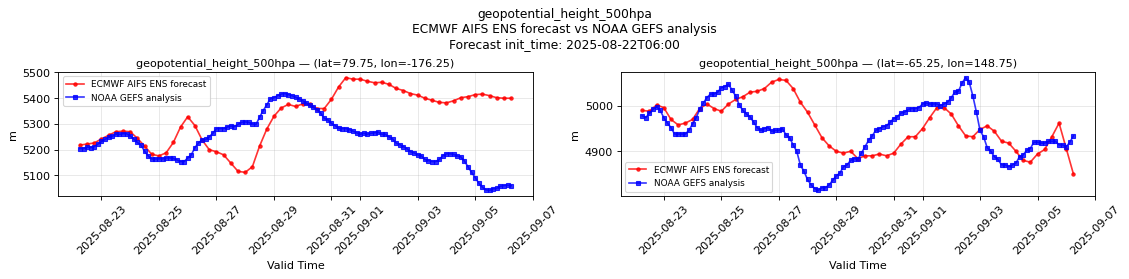
- plot:
temporal_geopotential_height_500hpa.png - period: Forecast init_time: 2025-08-22T06:00
P1 (lat=79.75, lon=-176.25):
- validation: min=5112, mean=5325, max=5480
- reference: min=5042, mean=5235, max=5418
P2 (lat=-65.25, lon=148.75):
- validation: min=4850, mean=4955, max=5058
- reference: min=4814, mean=4945, max=5062
Nulls
- P1 nulls: 0/3944748 — none
- P2 nulls: 0/3944748 — none
geopotential_height_850hpa
Metadata
- units:
m - long_name: Geopotential height
- short_name: gh
- standard_name: geopotential_height
- step_type: instant
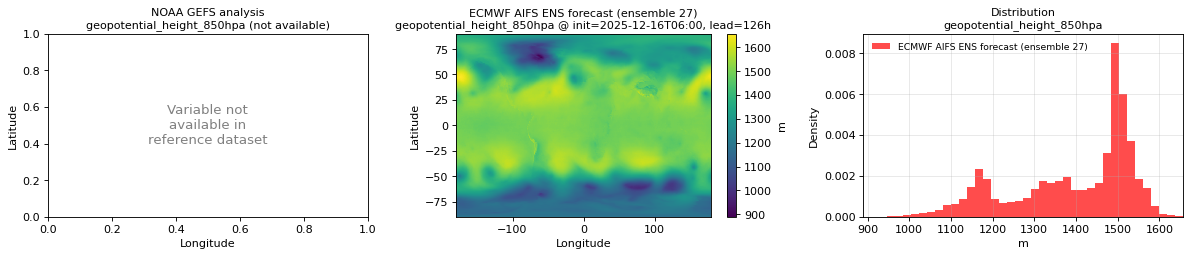
Spatial comparison
- plot:
spatial_geopotential_height_850hpa.png - time: init=2025-12-16T06:00, lead=126h (reference at 2025-12-21T12:00)
- validation: min=889.8, mean=1394, max=1656
- reference: variable not available in reference dataset
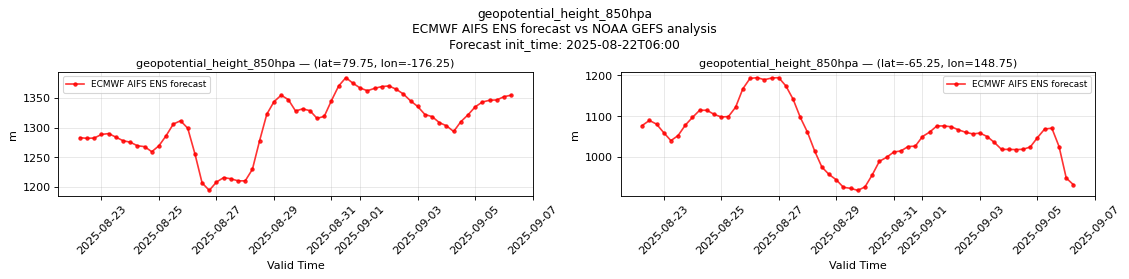
Temporal comparison
- plot:
temporal_geopotential_height_850hpa.png - period: Forecast init_time: 2025-08-22T06:00
P1 (lat=79.75, lon=-176.25):
- validation: min=1194, mean=1307, max=1384
- reference: variable not available in reference dataset
P2 (lat=-65.25, lon=148.75):
- validation: min=918, mean=1054, max=1194
- reference: variable not available in reference dataset
Nulls
- P1 nulls: 0/3944748 — none
- P2 nulls: 0/3944748 — none

geopotential_height_925hpa
Metadata
- units:
m - long_name: Geopotential height
- short_name: gh
- standard_name: geopotential_height
- step_type: instant
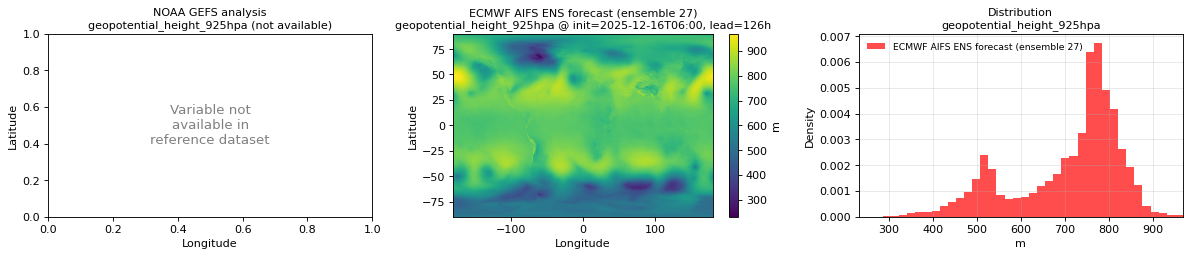
Spatial comparison
- plot:
spatial_geopotential_height_925hpa.png - time: init=2025-12-16T06:00, lead=126h (reference at 2025-12-21T12:00)
- validation: min=231.8, mean=708.8, max=969
- reference: variable not available in reference dataset
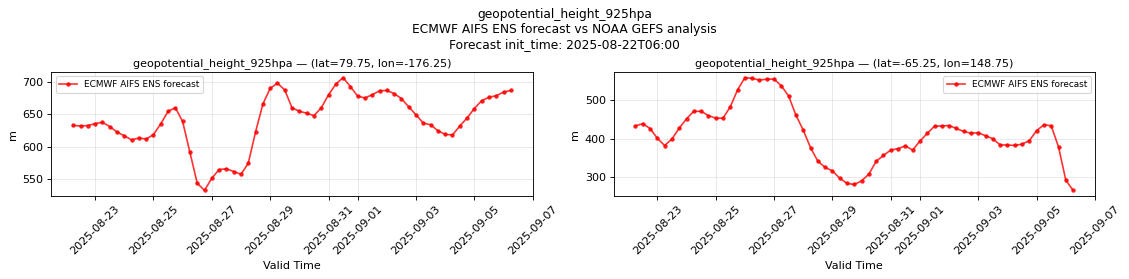
Temporal comparison
- plot:
temporal_geopotential_height_925hpa.png - period: Forecast init_time: 2025-08-22T06:00
P1 (lat=79.75, lon=-176.25):
- validation: min=532.5, mean=640.2, max=706
- reference: variable not available in reference dataset
P2 (lat=-65.25, lon=148.75):
- validation: min=265.8, mean=412, max=558
- reference: variable not available in reference dataset
Nulls
- P1 nulls: 0/3944748 — none
- P2 nulls: 0/3944748 — none

precipitation_surface
Metadata
- units:
kg m-2 s-1 - long_name: Precipitation rate
- short_name: prate
- standard_name: precipitation_flux
- step_type: avg
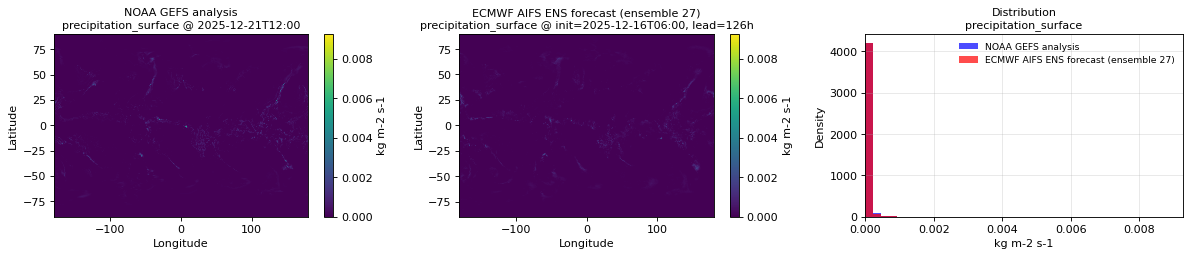
Spatial comparison
- plot:
spatial_precipitation_surface.png - time: init=2025-12-16T06:00, lead=126h (reference at 2025-12-21T12:00)
- validation: min=0, mean=2.462e-05, max=0.002823
- reference: min=0, mean=2.666e-05, max=0.009277
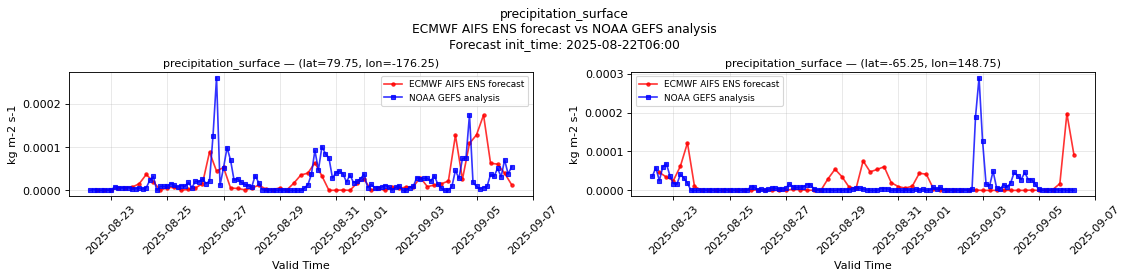
Temporal comparison
- plot:
temporal_precipitation_surface.png - period: Forecast init_time: 2025-08-22T06:00
P1 (lat=79.75, lon=-176.25):
- validation: min=0, mean=2.426e-05, max=0.0001745
- reference: min=0, mean=2.411e-05, max=0.0002613
P2 (lat=-65.25, lon=148.75):
- validation: min=0, mean=1.891e-05, max=0.0001974
- reference: min=0, mean=1.323e-05, max=0.0002899
Nulls
- P1 nulls: 0/3880080 — none
- P2 nulls: 0/3880080 — none
pressure_reduced_to_mean_sea_level
Metadata
- units:
Pa - long_name: Pressure reduced to MSL
- short_name: prmsl
- standard_name: air_pressure_at_mean_sea_level
- step_type: instant
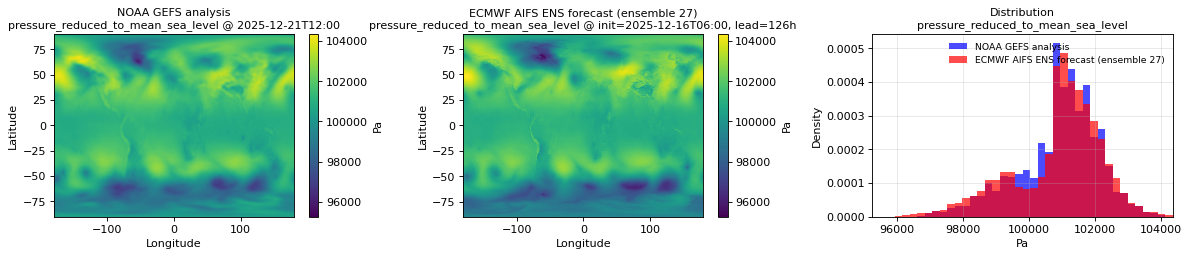
Spatial comparison
- plot:
spatial_pressure_reduced_to_mean_sea_level.png - time: init=2025-12-16T06:00, lead=126h (reference at 2025-12-21T12:00)
- validation: min=9.526e+04, mean=1.009e+05, max=1.044e+05
- reference: min=9.606e+04, mean=1.009e+05, max=1.041e+05
Temporal comparison
- plot:
temporal_pressure_reduced_to_mean_sea_level.png - period: Forecast init_time: 2025-08-22T06:00
P1 (lat=79.75, lon=-176.25):
- validation: min=9.898e+04, mean=1.003e+05, max=1.011e+05
- reference: min=9.862e+04, mean=9.992e+04, max=1.016e+05
P2 (lat=-65.25, lon=148.75):
- validation: min=9.568e+04, mean=9.769e+04, max=9.965e+04
- reference: min=9.664e+04, mean=9.827e+04, max=9.914e+04
Nulls
- P1 nulls: 0/3944748 — none
- P2 nulls: 0/3944748 — none


pressure_surface
Metadata
- units:
Pa - long_name: Surface pressure
- short_name: sp
- standard_name: surface_air_pressure
- step_type: instant
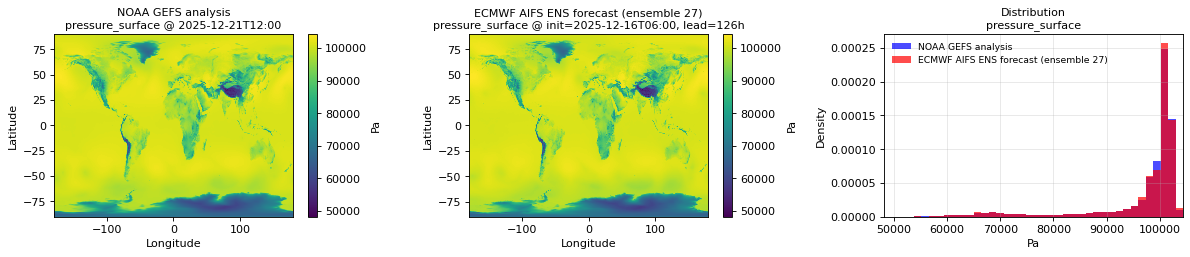
Spatial comparison
- plot:
spatial_pressure_surface.png - time: init=2025-12-16T06:00, lead=126h (reference at 2025-12-21T12:00)
- validation: min=4.813e+04, mean=9.664e+04, max=1.044e+05
- reference: min=4.954e+04, mean=9.663e+04, max=1.041e+05
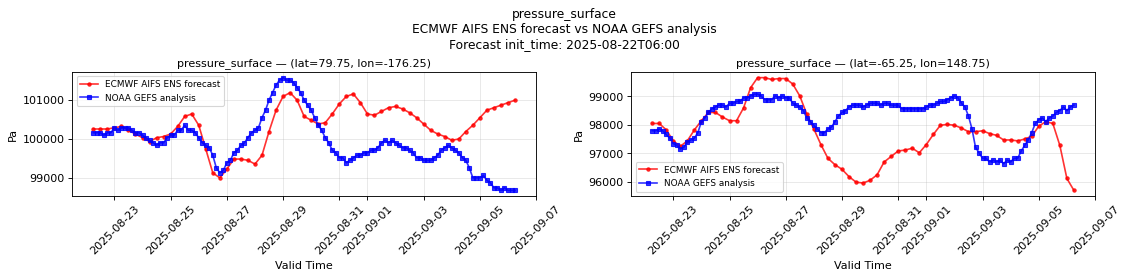
Temporal comparison
- plot:
temporal_pressure_surface.png - period: Forecast init_time: 2025-08-22T06:00
P1 (lat=79.75, lon=-176.25):
- validation: min=9.901e+04, mean=1.003e+05, max=1.012e+05
- reference: min=9.869e+04, mean=9.991e+04, max=1.016e+05
P2 (lat=-65.25, lon=148.75):
- validation: min=9.571e+04, mean=9.77e+04, max=9.965e+04
- reference: min=9.664e+04, mean=9.823e+04, max=9.907e+04
Nulls
- P1 nulls: 0/3944748 — none
- P2 nulls: 0/3944748 — none
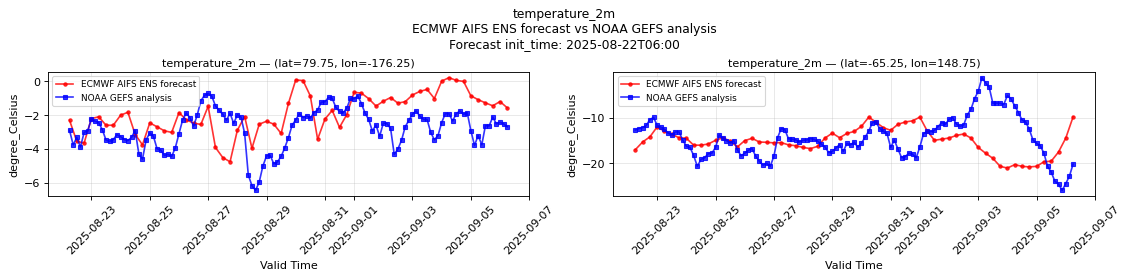
temperature_2m
Metadata
- units:
degree_Celsius - long_name: 2 metre temperature
- short_name: 2t
- standard_name: air_temperature
- step_type: instant
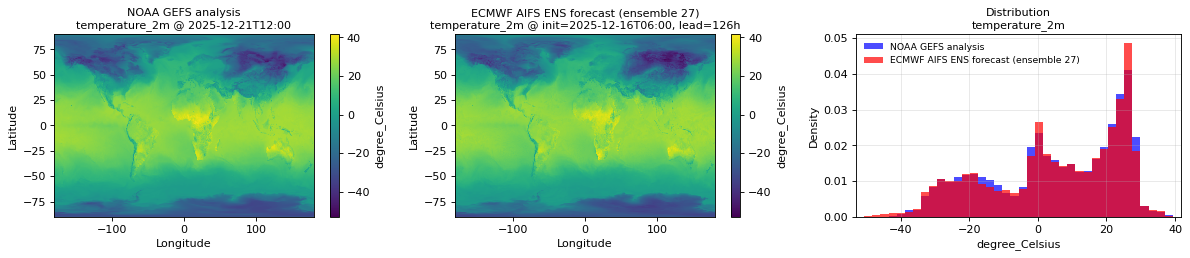
Spatial comparison
- plot:
spatial_temperature_2m.png - time: init=2025-12-16T06:00, lead=126h (reference at 2025-12-21T12:00)
- validation: min=-53, mean=5.111, max=41.75
- reference: min=-49, mean=5.133, max=41
Temporal comparison
- plot:
temporal_temperature_2m.png - period: Forecast init_time: 2025-08-22T06:00
P1 (lat=79.75, lon=-176.25):
- validation: min=-4.75, mean=-1.911, max=0.2158
- reference: min=-6.438, mean=-2.775, max=-0.7188
P2 (lat=-65.25, lon=148.75):
- validation: min=-21, mean=-15.1, max=-9.812
- reference: min=-25.88, mean=-14.39, max=-1.25
Nulls
- P1 nulls: 0/3944748 — none
- P2 nulls: 0/3944748 — none

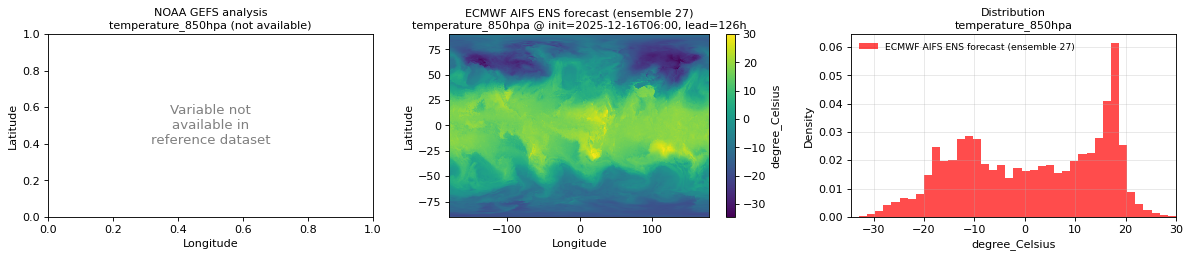
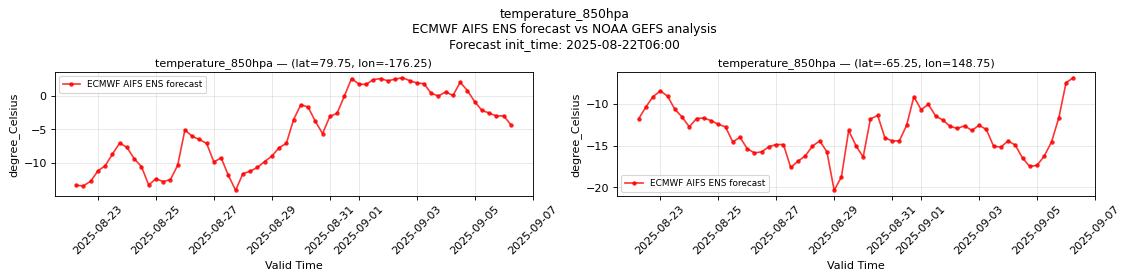
temperature_850hpa
Metadata
- units:
degree_Celsius - long_name: Temperature
- short_name: t
- standard_name: air_temperature
- step_type: instant
Spatial comparison
- plot:
spatial_temperature_850hpa.png - time: init=2025-12-16T06:00, lead=126h (reference at 2025-12-21T12:00)
- validation: min=-34.5, mean=1.221, max=30
- reference: variable not available in reference dataset
Temporal comparison
- plot:
temporal_temperature_850hpa.png - period: Forecast init_time: 2025-08-22T06:00
P1 (lat=79.75, lon=-176.25):
- validation: min=-14.12, mean=-5.1, max=2.766
- reference: variable not available in reference dataset
P2 (lat=-65.25, lon=148.75):
- validation: min=-20.38, mean=-13.46, max=-6.844
- reference: variable not available in reference dataset
Nulls
- P1 nulls: 0/3944748 — none
- P2 nulls: 0/3944748 — none

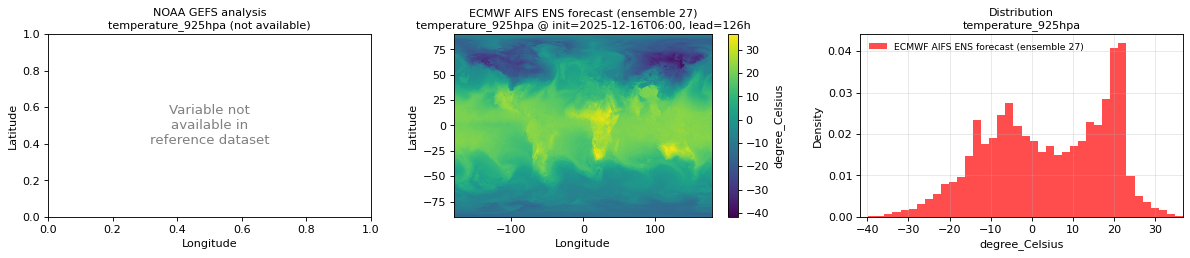
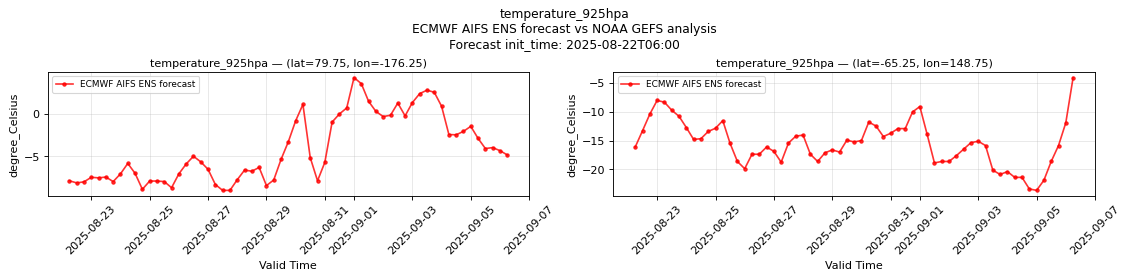
temperature_925hpa
Metadata
- units:
degree_Celsius - long_name: Temperature
- short_name: t
- standard_name: air_temperature
- step_type: instant
Spatial comparison
- plot:
spatial_temperature_925hpa.png - time: init=2025-12-16T06:00, lead=126h (reference at 2025-12-21T12:00)
- validation: min=-41.75, mean=3.793, max=36.75
- reference: variable not available in reference dataset
Temporal comparison
- plot:
temporal_temperature_925hpa.png - period: Forecast init_time: 2025-08-22T06:00
P1 (lat=79.75, lon=-176.25):
- validation: min=-9, mean=-4.138, max=4.219
- reference: variable not available in reference dataset
P2 (lat=-65.25, lon=148.75):
- validation: min=-23.62, mean=-15.49, max=-4.125
- reference: variable not available in reference dataset
Nulls
- P1 nulls: 0/3944748 — none
- P2 nulls: 0/3944748 — none

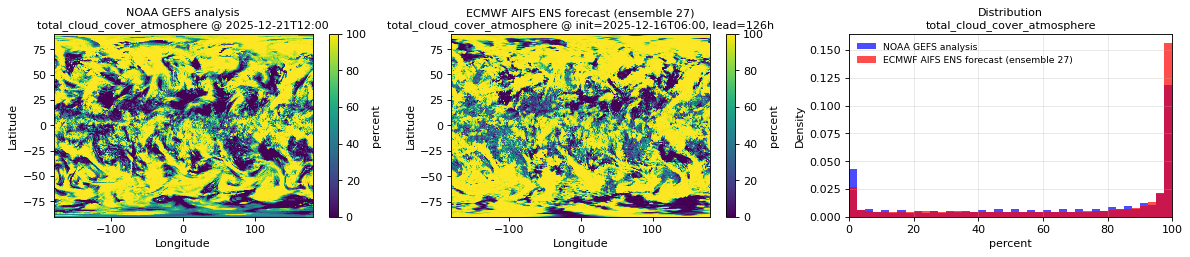
total_cloud_cover_atmosphere
Metadata
- units:
percent - long_name: Total cloud cover
- short_name: tcc
- standard_name: cloud_area_fraction
- step_type: instant
Spatial comparison
- plot:
spatial_total_cloud_cover_atmosphere.png - time: init=2025-12-16T06:00, lead=126h (reference at 2025-12-21T12:00)
- validation: min=0, mean=69.98, max=100
- reference: min=0, mean=63.99, max=100
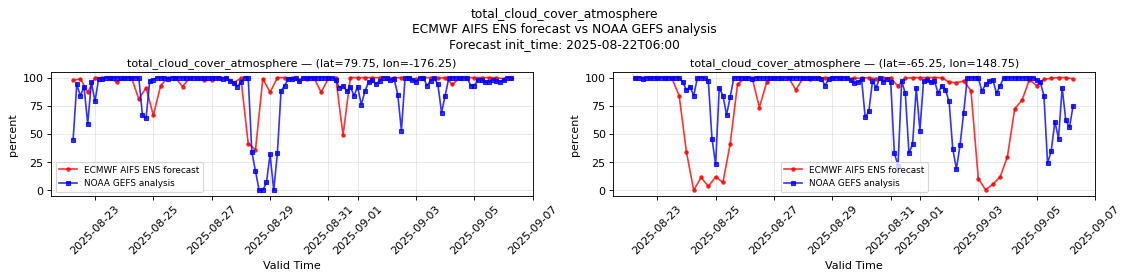
Temporal comparison
- plot:
temporal_total_cloud_cover_atmosphere.png - period: Forecast init_time: 2025-08-22T06:00
P1 (lat=79.75, lon=-176.25):
- validation: min=36, mean=94.74, max=100
- reference: min=0, mean=89.8, max=100
P2 (lat=-65.25, lon=148.75):
- validation: min=0, mean=80.43, max=100
- reference: min=19, mean=88.29, max=100
Nulls
- P1 nulls: 0/3944748 — none
- P2 nulls: 0/3944748 — none
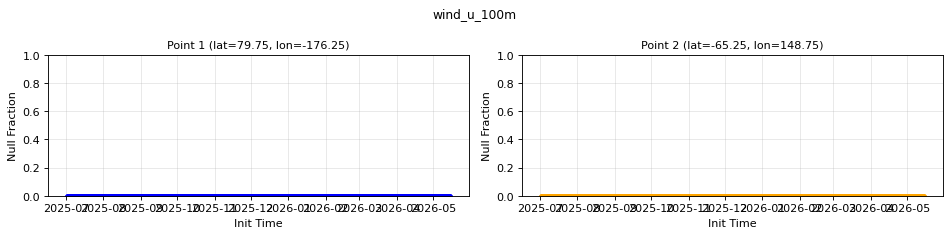
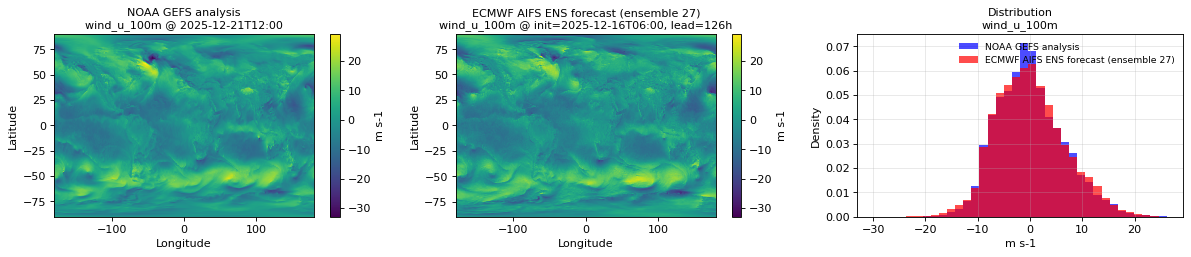
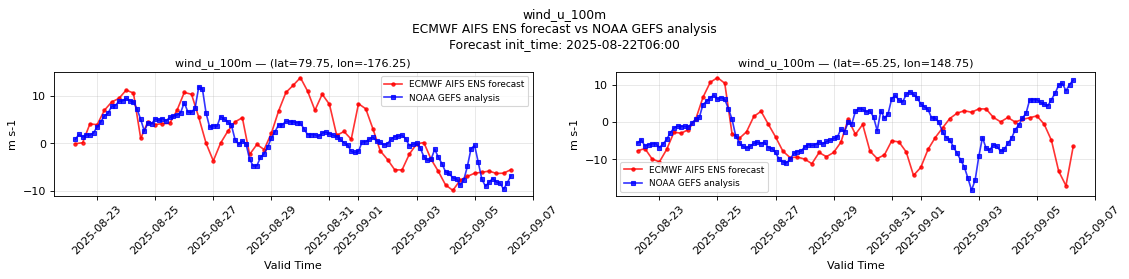
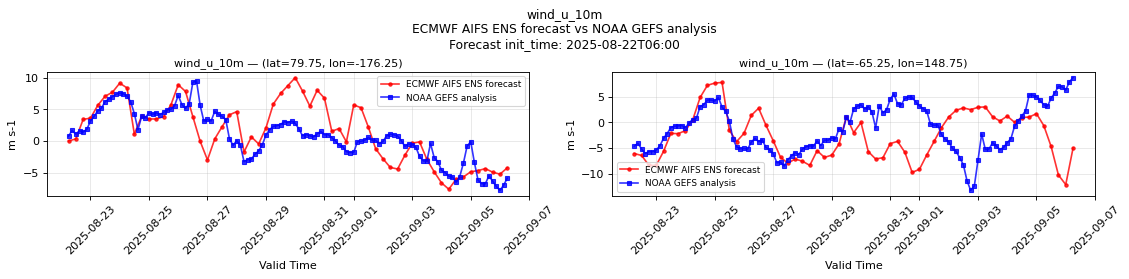
wind_u_100m
Metadata
- units:
m s-1 - long_name: 100 metre U wind component
- short_name: 100u
- standard_name: eastward_wind
- step_type: instant
Spatial comparison
- plot:
spatial_wind_u_100m.png - time: init=2025-12-16T06:00, lead=126h (reference at 2025-12-21T12:00)
- validation: min=-27.5, mean=0.08291, max=26.5
- reference: min=-33, mean=0.01432, max=29.25
Temporal comparison
- plot:
temporal_wind_u_100m.png - period: Forecast init_time: 2025-08-22T06:00
P1 (lat=79.75, lon=-176.25):
- validation: min=-9.875, mean=1.998, max=13.88
- reference: min=-9.625, mean=1.184, max=12
P2 (lat=-65.25, lon=148.75):
- validation: min=-17, mean=-3.373, max=11.88
- reference: min=-18.25, mean=-1.552, max=11.25
Nulls
- P1 nulls: 0/3944748 — none
- P2 nulls: 0/3944748 — none
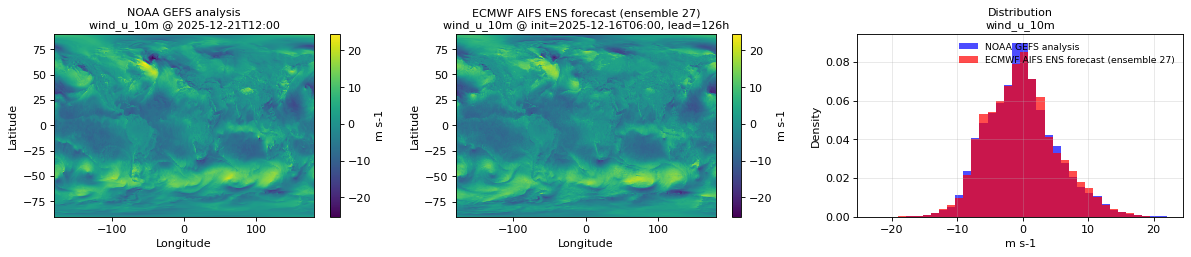
wind_u_10m
Metadata
- units:
m s-1 - long_name: 10 metre U wind component
- short_name: 10u
- standard_name: eastward_wind
- step_type: instant
Spatial comparison
- plot:
spatial_wind_u_10m.png - time: init=2025-12-16T06:00, lead=126h (reference at 2025-12-21T12:00)
- validation: min=-22, mean=-0.1035, max=20.25
- reference: min=-25.25, mean=-0.1763, max=24.5
Temporal comparison
- plot:
temporal_wind_u_10m.png - period: Forecast init_time: 2025-08-22T06:00
P1 (lat=79.75, lon=-176.25):
- validation: min=-7.625, mean=1.557, max=10
- reference: min=-7.812, mean=0.8425, max=9.5
P2 (lat=-65.25, lon=148.75):
- validation: min=-12.12, mean=-2.558, max=7.812
- reference: min=-13.25, mean=-1.159, max=8.75
Nulls
- P1 nulls: 0/3944748 — none
- P2 nulls: 0/3944748 — none

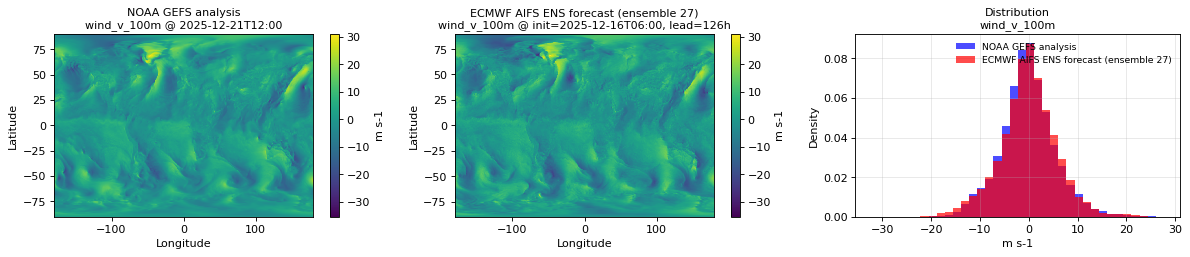
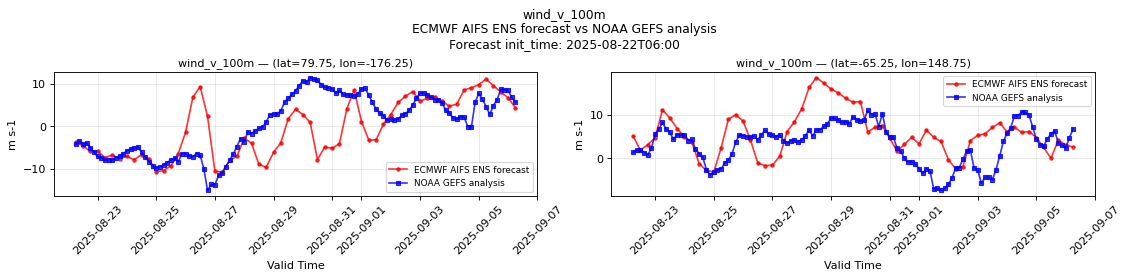
wind_v_100m
Metadata
- units:
m s-1 - long_name: 100 metre V wind component
- short_name: 100v
- standard_name: northward_wind
- step_type: instant
Spatial comparison
- plot:
spatial_wind_v_100m.png - time: init=2025-12-16T06:00, lead=126h (reference at 2025-12-21T12:00)
- validation: min=-27.5, mean=-0.08457, max=31
- reference: min=-35.5, mean=-0.1286, max=30.5
Temporal comparison
- plot:
temporal_wind_v_100m.png - period: Forecast init_time: 2025-08-22T06:00
P1 (lat=79.75, lon=-176.25):
- validation: min=-10.75, mean=-0.6802, max=11
- reference: min=-15, mean=0.3716, max=11.38
P2 (lat=-65.25, lon=148.75):
- validation: min=-3.125, mean=5.622, max=18.5
- reference: min=-7.375, mean=3.225, max=11
Nulls
- P1 nulls: 0/3944748 — none
- P2 nulls: 0/3944748 — none

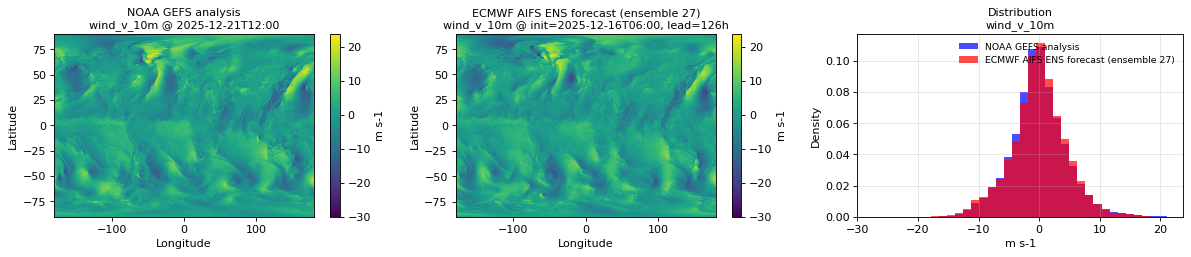
wind_v_10m
Metadata
- units:
m s-1 - long_name: 10 metre V wind component
- short_name: 10v
- standard_name: northward_wind
- step_type: instant
Spatial comparison
- plot:
spatial_wind_v_10m.png - time: init=2025-12-16T06:00, lead=126h (reference at 2025-12-21T12:00)
- validation: min=-21.5, mean=-0.05017, max=23.5
- reference: min=-30, mean=-0.1044, max=23.75
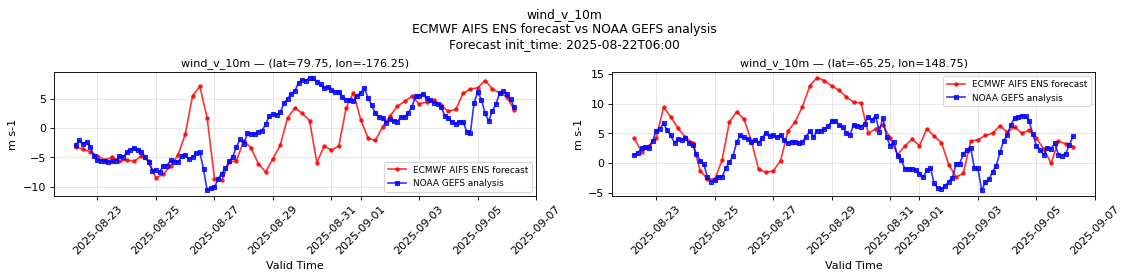
Temporal comparison
- plot:
temporal_wind_v_10m.png - period: Forecast init_time: 2025-08-22T06:00
P1 (lat=79.75, lon=-176.25):
- validation: min=-8.875, mean=-0.5707, max=8.125
- reference: min=-10.62, mean=0.2669, max=8.625
P2 (lat=-65.25, lon=148.75):
- validation: min=-2.75, mean=4.644, max=14.38
- reference: min=-4.625, mean=2.657, max=7.938
Nulls
- P1 nulls: 0/3944748 — none
- P2 nulls: 0/3944748 — none